
Identify Forex Scams in Simple Steps – Trading Critique
A forex trading scam is a scheme that tries to trick you by giving you money in the forex market. Scammers promise you to give high returns or guarantee profits. But this is unrealistic.
Back To Top
Chart patterns make an important part in the Technical analysis of stock trading. Understanding some basic stock chart patterns is essential for a stock trader.
In this article, you will learn about the 10 Essential and basic stock chart patterns that can definitely save your stock trades. You should definitely know these chart patterns before you proceed with your stock trading.
To know about the basics of stock trading, tradingcritique.com recommends you to read about Stock Trading: All you need to know about.
Stock chart patterns play an important role in any useful technical inquiry and can be a powerful asset for any trader at any level. The breakouts and reversals can give you profits when you learn to recognize the patterns early in your trading.
On a considerably basic level stock chart patterns are a way of looking at a series of price actions that occur during a stock trading period. The stock chart patterns can help you speculate the stock price movements in different times frames such as monthly, weekly, daily, intra-day, hours, minutes, and even seconds.
The important thing about the chart pattern is that they tend to repeat themselves over and over again. Stock chart patterns can contribute to identifying trend reversals and continuations.
The major stock chart patterns are Pennant, Cup and Handle, Ascending triangle, Descending triangle, Triple bottom, Inverse Head and shoulders, Bullish Symmetric triangle, rounding bottom, and Flag continuation.
A pennant is created when there is a serious movement in the stock, followed by a period of strengthening, this creates the pennant shape due to the converging lines. As the stock graph moves according to the price direction, a breakout movement occurs in the same direction.
These are very much alike to flag patterns and tend to last between one and three weeks. There will be a significant volume at the initial stock movement, followed by weaker volume in the pennant section, and growth in volume at the breakout.
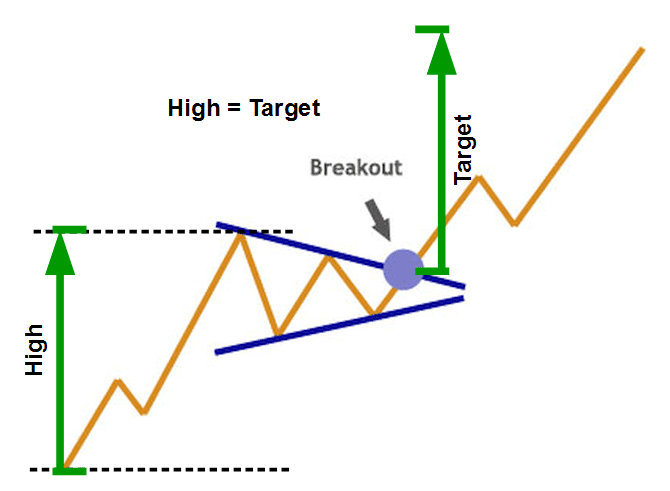
Image 1: The Pennant chart pattern.
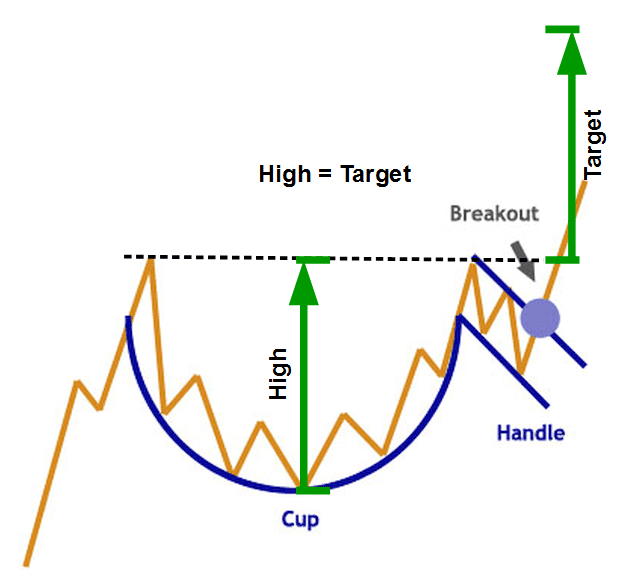
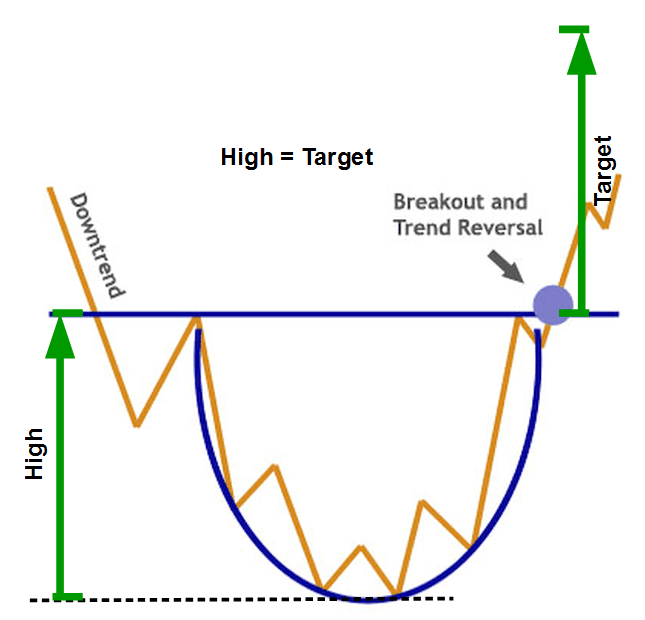
A cup and handle pattern gets its name from the understandable pattern it makes on the chart. The cup is a curved u-shape, while the handle slopes a little downwards. In general, the right-hand side of the diagram has a low trading volume, and it can last from 7 weeks up to around 65 weeks.
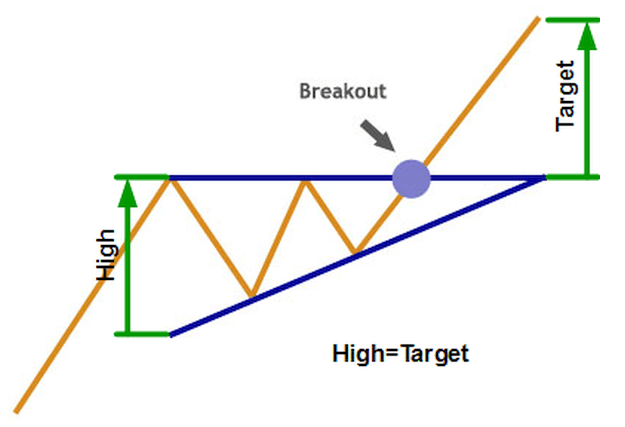
This triangle usually appears during an upward trend regarded as an additional pattern. It is a Bullish pattern. Sometimes it can be created as part of a reversal at the end of a downward trend, but more commonly it is a continuation. Ascending triangles are eventually bullish patterns whenever they appear.
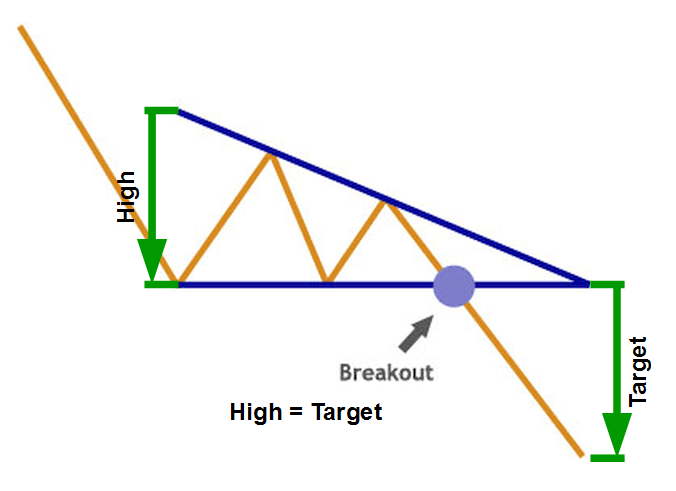
The descending triangle is another addition pattern, but this triangle is an irascible pattern and is usually created as a continuation during a downward trend. Now and then it can be seen as a reversal during an upward trend, but it is considered to be a continuation.
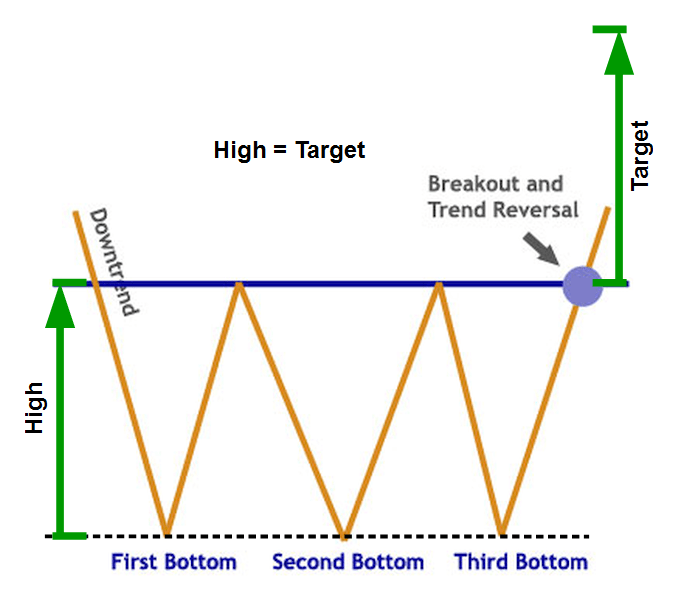
This triple bottom pattern is used in technical analysis as a predictor of an opposite position following a long downward trend. The triple bottom takes place when the price of the stock generates three distinct downward prongs, at around the same price level, before breaking out and reversing the trend.
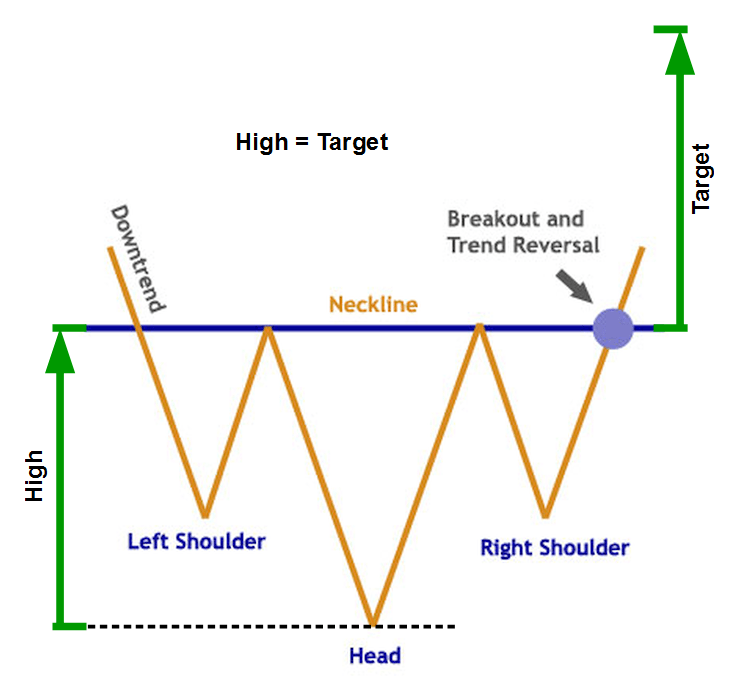
The reversal of a downward trend can be speculated using the stock chart pattern called the Inverse Head and Shoulders. It is also called the “head and shoulders bottom” or even a “reverse head and shoulders,” but all these names mean the same thing within technical analysis.
This stock chart pattern gets its name from its shape. The inverse head and shoulder pattern has one downward longer peak forming the head, followed by two downward level peaks on its either side which creates the shoulder.
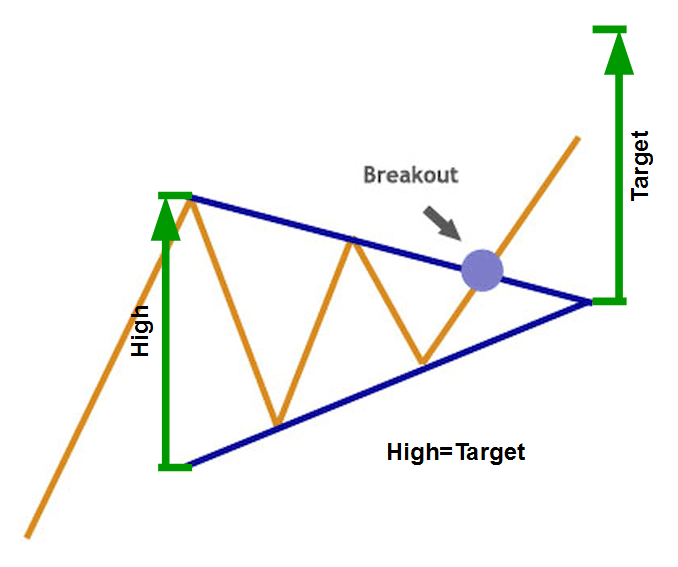
The symmetrical triangle pattern is not difficult to spot, thanks to the different shape which is created by the two trendlines which converge. This pattern takes place by drawing trendlines, which connect a series of peaks and troughs. The trendlines create a barrier. A very sharp movement of price follows when it breaks through this barrier.
This pattern is sometimes also called a “saucer bottom” and establish a long-term reversal showing that the stock is moving from a downward trend towards an upward trend instead. It can last anytime from several months to years. It is very much alike to the cup and handles, but in this case, there is no handle to the pattern, hence this name.
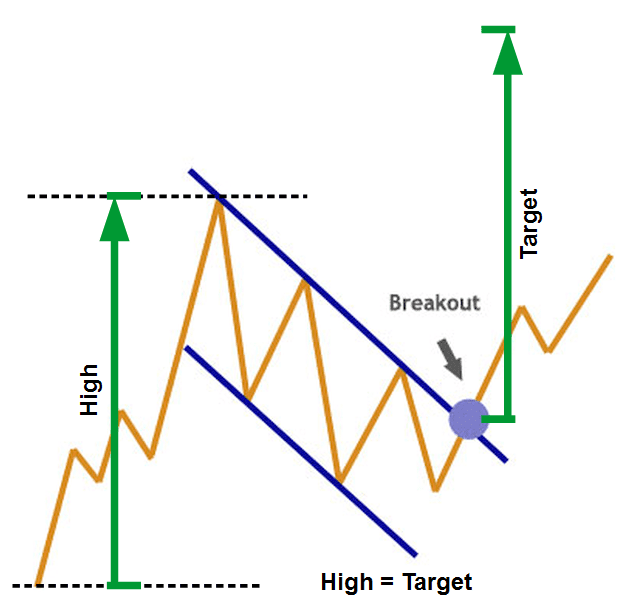
The flag chart pattern forms through a rectangle. The rectangle prospers from two trendlines which form the support and opposition until the price breaks out. The flag will have to slant trendlines, and the slope should move in a completely different direction to the original price movement. The buy or sell signal can be guessed when the price breaks through the support or resistance lines.
In conclusion, all the above-mentioned chart patterns are the basic chart patterns which you should thoroughly know being a stock trader. Finding out and predicting the future chart patterns is the key to make your stock trades successful.
Which of the chart patterns do you think is the most essential for stock trading? Comment your answers below. If you have any queries you can ask in the comments section below. Our Trading Critique Experts will answer it. Get answers to your personalized questions here. To get regular updates from tradingcritique.com, Subscribe to our Newsletter.

A forex trading scam is a scheme that tries to trick you by giving you money in the forex market. Scammers promise you to give high returns or guarantee profits. But this is unrealistic.

An index fund is a collection of investments that follows the performance of a group of companies or a market index. For example, the S&P 500. It is like a large basket of investments that mirrors the performance of these selected companies. Instead of choosing individual stocks, the fund follows preset rules set by companies like S&P Dow Jones Indices.

Forex trading (foreign exchange trading) is the act of buying and selling currencies globally. In this guide, we will explain forex scams, how to spot a forex scam, and tips to avoid them.

Small enterprises can attract seasoned and skilled candidates by providing straightforward, dependable, and adaptable retirement schemes. Certain types of plans can even provide tax benefits. Here, we will explore the different types of retirement plans available to small businesses and how to establish them.

Foreign exchange trading involves exchanging one currency for another. By profiting from fluctuations in exchange rates between currencies, forex traders aim to generate returns on their investments. It operates 24 hours a day as currencies are traded across time zones.

Systematic investment plans offer a systematic approach to investing that allows individuals to invest a fixed amount of money in their preferred investment instruments on a regular basis. SIPs have several benefits including steady investment, versatility, the possibility of dollar-cost averaging, and the opportunity to start with small amounts of money.
