
Should beginners start with candlestick charts? This guide will clear all your doubts about how to read candlestick charts for beginners and identify key patterns like bullish reversal patterns and bearish engulfing patterns. By understanding price movement and candlestick patterns, beginners can gain insights into market sentiment and make informed trading decisions. Recognizing potential trend reversals helps traders spot opportunities and manage risks effectively.
Quick insights
What is a candlestick chart?
- Candlestick charts are a key tool in trading and technical analysis. They help traders understand market trends and make predictions about price movements over a set period of time (like a day, hour, or minute).
- The candlestick chart was invented by Munehisa Homma, a Japanese businessman, in 1750 to predict rice prices before entering contracts.
- Today, this method is widely used in various markets, including stocks, currencies, commodities, and other securities, to help traders and investors forecast price movements based on demand, supply, and market sentiment.
- There are about 35 to 42 recognized candlestick patterns, but traders typically focus on about 25 of the most commonly used patterns.
Understanding candlestick charts: Basics and component
Candlestick charts are a powerful tool for traders to visualize price movements and potential market trends.
The diagram below is an example that illustrates the candlestick structure showing the body, upper wick, lower wick, open and close prices, and the high and low prices for both bullish and bearish candles.

Candlestick body
- The body of the candlestick represents the price action range between the opening and closing prices for a specific time period.
- Green/white body: If the body is green or white, it indicates that the closing price was higher than the opening price, signaling bullish sentiment (price went up).
- Red/black body: If the body is red or black, it indicates that the closing price was lower than the opening price, signaling a bearish sentiment (price went down).
- Body length: A longer body suggests stronger buying or selling pressure, while a shorter body indicates indecision or weaker momentum.
The wicks or shadows
- The thin lines extending above and below the body show the highest and lowest prices reached during that period.
- Upper wick: Represents the range between the highest price and the closing price (or opening price if bearish). A long upper wick suggests that prices were driven higher but faced selling pressure.
- Lower wick: Represents the range between the lowest price and the opening price (or closing price if bullish). A long lower wick suggests that prices were driven lower but found buying support.
Open price
- The first price at which the asset is traded during the specified period. It’s the starting point for that candlestick.
Close price
- The last price at which the asset is traded during the specified period. It’s the ending point for that candlestick.
High price
- The highest price reached by the asset during the specified period. It’s represented by the top of the upper wick.
Low price
- The lowest price reached by the asset during the specified period. It’s represented by the bottom of the lower wick.
Time frames
- A time frame refers to the specific time interval represented by each candlestick on a chart.
- This interval can vary, ranging from as short as one minute to as long as several months, depending on the trader’s analysis and strategy.
Top candlestick patterns every trader should know
Here’s a list of key candlestick patterns every trader should know
Bullish candlestick patterns
These patterns suggest a potential upward movement in the market:
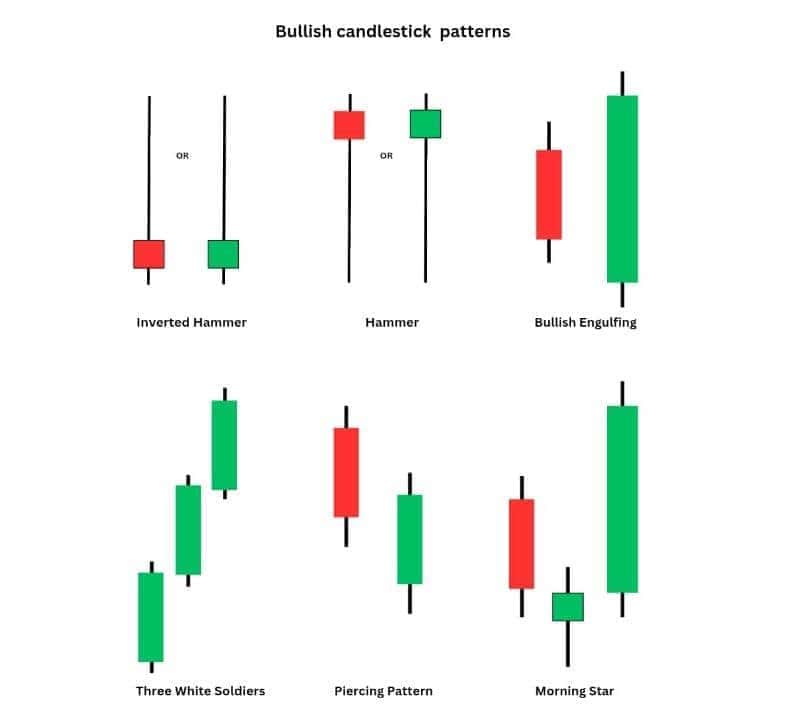
Bullish engulfing pattern
A small bearish candle is followed by a larger bullish candle, which completely engulfs the previous one. It indicates strong buying pressure.
Hammer
A single candle with a small body and a long lower wick. It usually appears after a downtrend and signals a potential bullish reversal. The long lower wick shows that sellers pushed prices down, but buyers stepped in and drove prices back up before the candle closed.
Inverted hammer
An inverted hammer appears after a downtrend and suggests a potential bullish reversal. It has a small body at the bottom and a long upper wick, showing buyers attempted to push prices up. Confirmation from the next bullish candle strengthens the signal.
Morning star
A three-candle pattern: a long bearish candle, a small-bodied candle (either bullish or bearish), and then a long bullish candle. This pattern suggests a reversal from a downtrend to an uptrend.
Piercing line
A two-candle pattern where the first is a long bearish candle, followed by a bullish candle that opens below the previous low but closes above the midpoint of the first candle.
Three white soldiers
A three-candle pattern where three consecutive long bullish candles appear. It shows strong buying momentum.
Bearish reversal patterns
These patterns suggest a potential downward movement in the market:
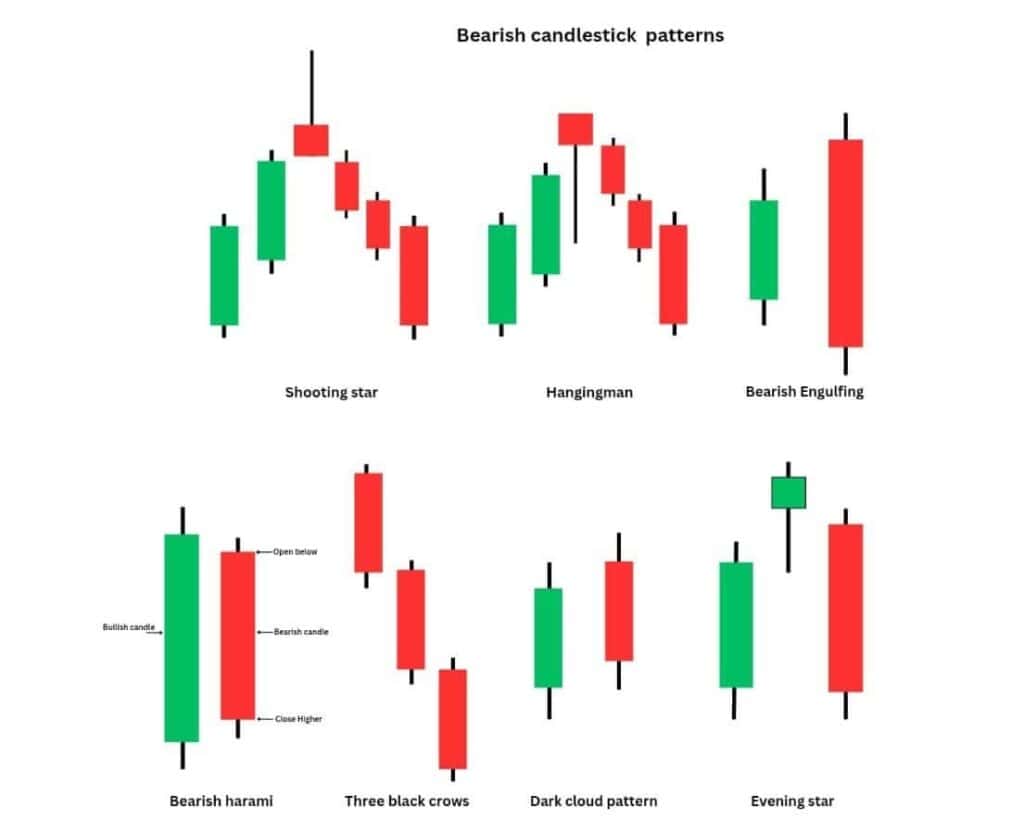
Bearish engulfing patterns
A small bullish candle is followed by a larger bearish candle, which engulfs the first candle. It signals a shift from buying to selling pressure.
Hanging man pattern
A single candle with a small body near the top of the trading range and a long lower wick appears during an uptrend. It suggests that sellers are gaining control, which is one of the key pieces of information traders watch for when anticipating a reversal to a downtrend.
Shooting star pattern
A single candle with a small body at the bottom and a long upper wick, indicating a reversal after an uptrend. It shows that buyers tried to push the price higher, but sellers took control.
Evening star
A three-candle pattern: a long bullish candle, followed by a small-bodied candle (either bullish or bearish), and then a long bearish candle. It suggests a reversal from an uptrend to a downtrend.
Dark cloud cover
A two-candle pattern where the first is a long bullish candle, followed by a bearish candle that opens above the high of the first candle and closes below its midpoint.
Bearish harami
A two-candle pattern where a large bullish candle is followed by a small bearish candle that fits entirely within the body of the previous candle. This suggests indecision and potential reversal.
Three black crows
A three-candle pattern where three consecutive long bearish candles appear, suggests that selling pressure.
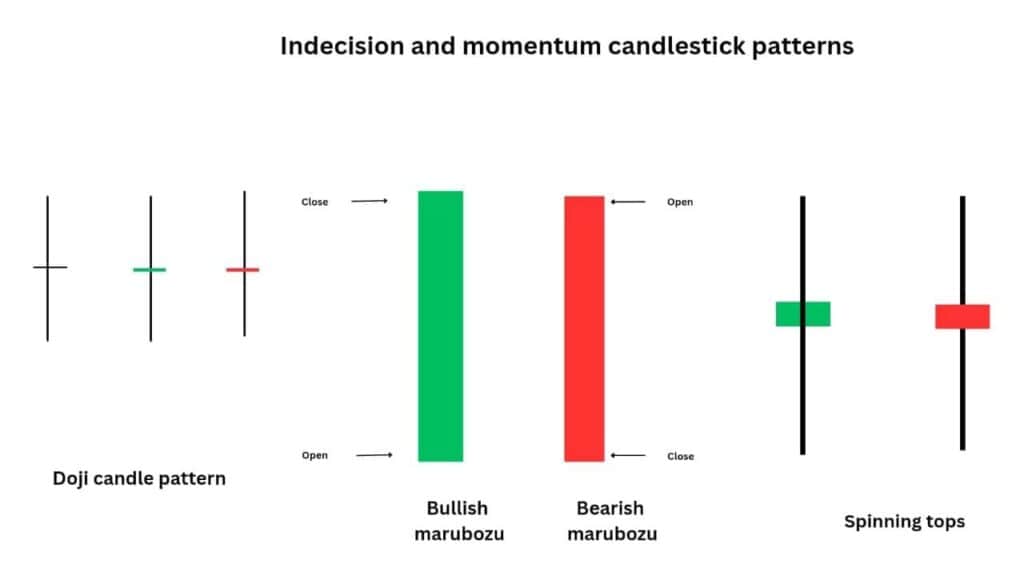
Indecision and momentum candlestick patterns
These patterns reflect periods of market uncertainty or strong directional movement, often signaling potential reversals or continuations based on price behavior.
Doji
A Doji candle has a very small body, indicating indecision in the market. It can appear in both bullish and bearish contexts and often signals potential trend reversals when found at the top or bottom of a trend.
Spinning top
This candle has a small body and long upper and lower wicks, indicating indecision. It can be a sign of a potential reversal or consolidation.
Marubozu
A candle with no wicks, meaning the open price is the low for bullish Marubozu, and the close price is the high for bearish Marubozu. This pattern shows strong momentum in one direction.
Applying candlestick analysis across markets
Candlestick analysis is a versatile technique applicable to various financial markets:
Forex market
How to read the candlestick chart in forex trading? Currency traders use candlestick charts to understand the fluctuations of currency pairs and identify potential trends and trading opportunities based on patterns formed by exchange rates. Patterns like Doji, engulfing, and morning star are often used to identify trends.
Stock market
Candlestick patterns in stocks often highlight market sentiment and are useful around earnings reports, news, or technical levels (support/resistance). Patterns like bullish engulfing and piercing line help traders predict price movement.
Cryptocurrency market
In the highly volatile crypto market, candlestick analysis is useful for identifying sudden price shifts. Patterns like hammer, shooting star, and engulfing can signal quick reversals or continuation of trends.
Commodity market
Traders analyze candlestick charts to understand the supply and demand dynamics affecting commodity prices (e.g., oil, gold, agricultural products).
Advanced tips for day trading using candlestick charts
How to read candlestick chart for day trading? Combine candlestick patterns with indicators like Moving Averages, RSI, MACD, and Bollinger Bands to confirm signals and filter out false ones.
For traders looking to enhance their day trading strategies, combining candlestick patterns with powerful Forex indicators can refine your approach. Learn about the 6 best forex indicators to improve your trading decisions confidently.
- Watch trading volume high volume during a pattern’s formation suggests stronger market interest and validity of the signal.
- Use multiple time frames to get a clearer view of patterns on smaller time frames may be part of a larger trend.
- Look for confluence, where multiple technical signals align, such as a candlestick pattern at a key support level or Fibonacci retracement.
- Focus on high-probability setups by spotting key pieces of information pushing the price higher or signs that sellers are gaining control, especially when these align with strong technical levels.
- Always use stop-loss orders and understand the risk-reward ratio for each trade to manage risk effectively.
- Backtest strategies using historical data to evaluate the accuracy and effectiveness of specific candlestick patterns.
- Be adaptable market conditions change, and the effectiveness of patterns may vary over time.
Conclusion
Candlestick charts are a powerful tool for understanding price movements and spotting trends. By recognizing key patterns like bullish and bearish reversals, traders can make informed decisions. For better accuracy, always confirm candlestick signals with indicators or volume. Regular practice will help you become more confident in using these charts for your trades.
Pro Tip
Always confirm candlestick signals with volume or technical indicators to increase reliability. Compare our best Forex brokers using our broker finder tool and stay updated on stocks for smarter trading decisions. Share your experience in the comments below!
Frequently Asked Questions
1. How to read red and green candlestick bars?
- A green candlestick indicates upward movement. The closing price is higher than the opening price (bullish).
- The red candlestick indicates downward movement. The closing price is lower than the opening price (bearish).
2. Can I trust candlestick patterns for signals?
Candlestick patterns can be helpful, but they should be used alongside other tools, like technical indicators or fundamental analysis, to increase accuracy and reduce risk.
3. Can I use candlestick charts for long-term trading?
Yes, candlestick charts can be used for long-term trading to identify trends, patterns, and key price levels, helping traders make informed decisions on entry and exit points.
4. Is candlestick analysis worth learning in 2026?
Yes, candlestick analysis is still worth learning in 2026. It helps identify trends and reversals, providing valuable insights when combined with other technical tools.